Fitbit Data Analysis
For Christmas I was lucky enough to get a Fitbit Charge HR from my wife. The fact that I’d previously asked for one to ‘do data analysis on’ slightly mystified and amused her, but she still went ahead and suprised me with it!
I’ve been hoping to use the monitor as a way to personalise an analysis of data, to see how the results feel when they relate to me (and especially my health), rather than some data that are abstract from me as an indivdual. If at the same time I can view my own health through new tools, then it’s a bonus.
Here I outline how I go about storing and analysing the heart rate data generated by the device using Postgres, Pandas and a Jupyter notebook.
Charge HR
In terms of sensors, the Charge HR is well equipped: it has an optical heart rate monitor, a 3-axis accelerometer and an altimeter. These produce high resolution heart rate (hr) data, length of time asleep (and quality of sleep), floors climbed and an estimate of the number of minutes the wearer is ‘active’ for a day. This is all pretty comprehensive, but for this post I’m focussing on my hr data, and in particular what Fitbit calls intraday data, which are heart rate data at up to 1 second resolution.
Accessing the Data
There are two ways to get access to intraday data. Either pay $49.99 a year on a Fitbit Premium subscription which allows export of the data in CSV format, or gather the data using Fitbit’s API. Obviously I’m not going to pay to get data when I can do the same for free, but I think there are some questions to be asked about requiring paid access to your own personally generated data if you lack the technical skills to gather them through an API.
In any case, to get the data I used the following method.
- Sign up for the Fitbit API and register a ‘personal’ type app. The important aspects here are ensuring the Browser app type is selected and the callback url is set to
http://127.0.0.1:8080/. - Install python-fitbit into whatever Python environment you’re working with. At the time of writing, I needed to install from master on github rather than PyPi due to issues with OAUTH2 authentication. The fixed version may be released by the time you read this post.
- Run the
gather_keys_oauth2.pyscript available in the repo, passing it the client id and client secret for your app (which are available on the manage my apps page of the Fitbit site). Save the access token and refresh tokens in a file. I used a simple JSON file called tokens.json with the format:
{
  "ACCESS_TOKEN": "YOURACCESSTOKEN",
  "CLIENT_SECRET": "YOURCLIENTSECRET",
  "REFRESH_TOKEN": "YOURREFRESHTOKEN",
  "CLIENT_ID": "YOURCLIENTID"
}
4.Clone my heart_rate_analysis repo, and run the setup_hr_db.py script. This requires postgres and a database called fitbit (though you can change the connection_string to something else if you want, the script relies on SQLAlchemy). I’m using Postgres as I wanted to try mixing SQL and JSON in a single database. If you’ve saved a tokens.json file in the same directory as this script, it will read in your keys from there, otherwise specify their location in main().
Analysis in Jupyter with Pandas
I looked at the data using the ubiquitous Jupyter Notebooks, and I’ve saved the basic investigative analyses I’ve done on these data to the repo in the link above (click through to see the rendered noteboom on GitHub.
The basic flow is:
- Connect to the db using psycopg2
- Using SQL, expand the JSON Arrays to individual JSON values:
SELECT r_hr,
       DATE,
       Jsonb_array_elements(hr) #> '{time}'  AS TIME,
       Jsonb_array_elements(hr) #> '{value}' AS value
FROM heart_rate- Read these into pandas as a dataframe
- Reset the index as datetime objects
This then allows you to slice, dice and resample the data using time periods and dates, for example going from all the data:
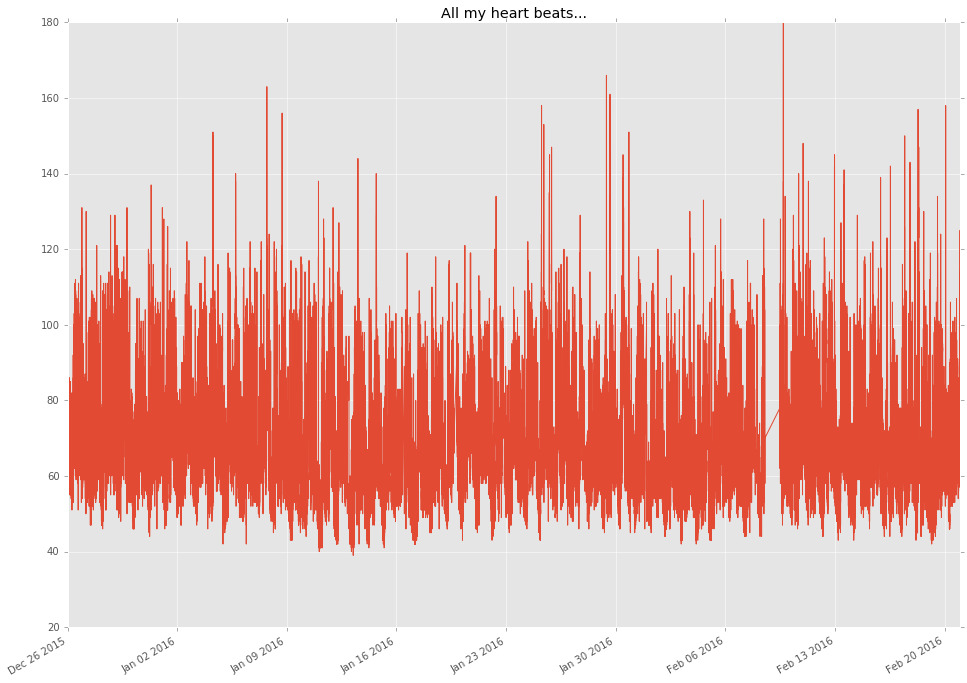
to daily means:
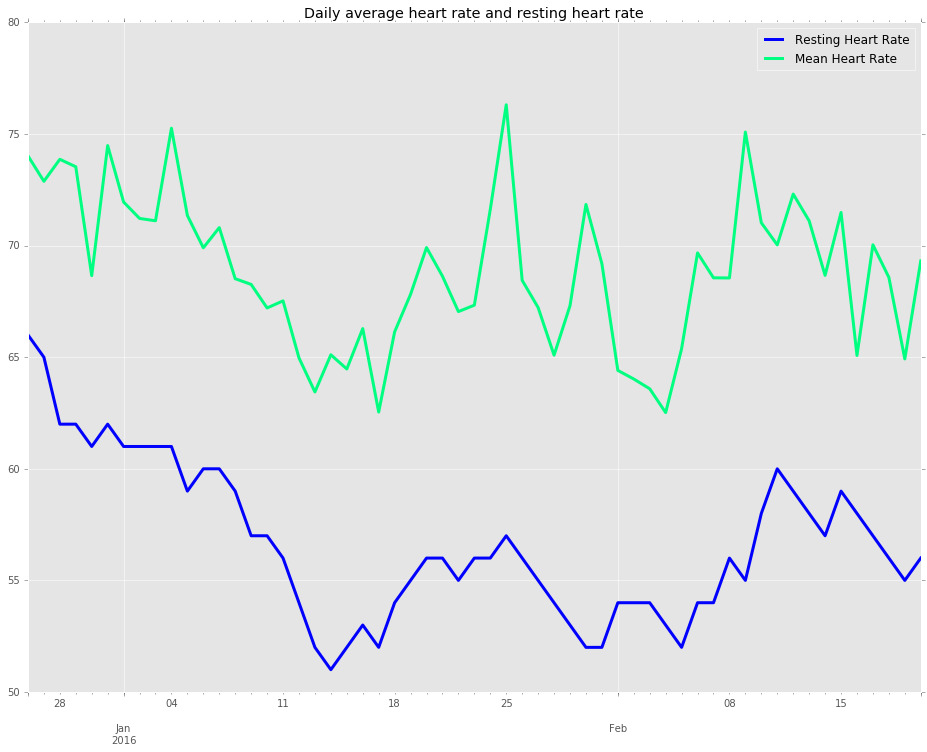
is just one line of code:
# Resample to day using mean
dfrsmpl = df.resample('D', how='mean')
If you’ve cloned my repo, you can use this notebook to run the same analyses on your own data.
Next steps
I don’t have much in the way of a time series yet, and it will be interesting to see how my heart rate changes over time (especially in relation to periods of the year where I’ll be doing more or less exercise, i.e. Christmas).
Obviously this is only one aspect of the data collected by the Charge HR, and it might be possible to look at correlations between other data and my heart rate, but at the moment, I don’t have any hard plans to do huge amounts of analysis on what is really a pet project. If that changes, I’ll add some further blog posts.